Core Web Vitals are metrics introduced by Google to give weight to user experience (UX) in website search rankings. These metrics were set to roll out in May 2021 and have been generating a lot of discussion. Even without knowing exactly how significant their impact on your rankings will be, it’s still essential to prepare for them and try to optimise your pages in line with the data and expectations Google has communicated.
And on that note, good news, fellow entrepreneurs! You may have noticed a few improvements in your Core Web Vitals site diagnostics on Google Search Console over the past day or two, even without having made any significant changes to your site.
Let’s take a closer look at these changes, which may seem minor but will almost certainly have an impact on how your website is evaluated.
What Has Changed for Core Web Vitals in Search Console
For each of the three metrics measured by Core Web Vitals (LCP, FID, and CLS), the thresholds between green, amber, and red scores have been updated. To move from red to amber, and from amber to green, you no longer need a score strictly below the threshold: a score less than or equal to the limit is now sufficient.
What Does This Mean for Your SEO?
This change, which may appear minor at first glance, introduces greater tolerance and will almost certainly have a positive impact on how your website is evaluated in terms of Core Web Vitals. Google stated that “you may notice changes” and that these will be “for the better.”
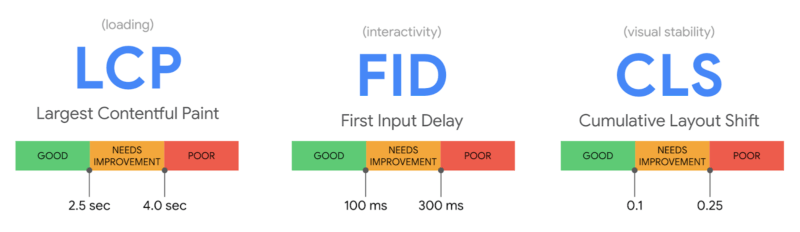
More Information on the LCP, FID, and CLS Metrics
LCP (Largest Contentful Paint)
Largest Contentful Paint looks at page load speed, specifically the time it takes to render the largest element on the page. This could be a banner image or a video. It assigns a score based on how quickly that element loads, with the goal of improving user experience and minimising bounce rate.
FID (First Input Delay)
This metric measures how quickly your website responds after a user’s first interaction with a link, a button, or another interactive element. Again, this indicator is important for highlighting your site’s interactivity and how easy it is for users to navigate.
CLS (Cumulative Layout Shift)
Cumulative Layout Shift measures the visual stability of a page as it loads. Some pages undergo multiple layout shifts during loading, which negatively impacts the user experience. This metric helps you identify pages that are problematic in this regard.
These Core Web Vitals are well worth optimising, not only because of their SEO impact, but because improving user experience has always been recommended as a way to build customer loyalty, reduce bounce rate, and maximise conversion rate.
For more information on this topic, check out our complete article on Core Web Vitals and the role of UX in SEO strategies.
Why Our Agency Considers These Changes Important
With the update arriving in May and putting user experience at the heart of organic search rankings, every change matters when it comes to preparing and optimising your site effectively. As noted above, we still don’t know how significant the impact will or won’t be, but it will always make a difference at the margins.
And ultimately, isn’t optimising the user experience a worthwhile goal in its own right? In a world where content is emerging from every direction and most channels are already saturated, what better approach than to prioritise our users, who will reward us in their own way?
If these metrics can help raise awareness among all stakeholders of the importance of UX and improve the overall quality of websites on the internet, then everyone stands to benefit.
For more information, and perhaps a few more philosophical tangents along the way, feel free to visit us at Donutz Digital. We are experts in PPC, Google Ads, SEO, and social media.
Your site takes 4 seconds to load. You may not know it, but Google certainly does. And since March 2024, it has been penalising that slowness more severely than ever. Core Web Vitals are no longer just one metric among many in your SEO dashboard. They have become the thermometer Google uses to measure the health of your site, and therefore your ability to rank well in its search results.
In 2026, only 47% of websites meet Google’s recommended thresholds. The remaining 53% lose between 8% and 35% of conversions, traffic, and revenue. Not because their content is poor, but because the user experience they deliver simply does not hold up against Google’s web performance requirements.
If you run a small business, manage marketing for a company, or oversee your organisation’s digital strategy, this article explains clearly what Core Web Vitals are, why they impact your search rankings, and most importantly how to optimise them without being a developer.
What Are Core Web Vitals in 2026?
Core Web Vitals are three metrics defined by Google to assess the real user experience SEO of your web pages. Not a theoretical speed measured in a lab, but the actual experience your visitors have on their own devices, on a 4G connection from the Paris metro or the office Wi-Fi.
Each metric measures a different aspect of the experience. LCP (Largest Contentful Paint) evaluates how quickly the main content appears. INP (Interaction to Next Paint) measures how responsive your site is to clicks and interactions. CLS (Cumulative Layout Shift) measures visual stability during loading.
These three indicators make up what Google calls the Page Experience signal. If even one of them falls into the red, your entire page is considered to offer a poor user experience. And Google adjusts your ranking accordingly.
The major change from 2024, whose effects are now fully felt in 2026, is the replacement of FID by INP. Why this shift? Because FID only measured the first interaction on your page. If the first click responded in 50 milliseconds, you had a perfect score, even if every subsequent click took 800 milliseconds to react. INP, by contrast, measures all interactions throughout the entire session. As a result, 43% of sites now fail the 200 millisecond INP threshold, making it the most difficult Core Web Vitals metric to pass in 2026.
The Three Core Web Vitals Explained
LCP: The Page Load Speed That Actually Matters
Largest Contentful Paint measures the time it takes to display the largest visible element on your page, typically a hero image, a header video, or a main text block. The target: under 2.5 seconds between the page request and the display of that element.
Why this metric rather than another? Because it reflects the moment when your visitor thinks the page has finished loading. Even if technically it hasn’t, that is the moment they start reading, interacting, and deciding whether to stay or leave.
A high LCP kills your conversions before the visitor has even seen your offer. Amazon calculated that one additional second of latency cost them 1.6 billion dollars per year. At your scale, the mechanism is identical: every tenth of a second lost translates into visitors who bounce.
The main causes of a poor LCP are often the same: an unoptimised main image (not compressed, not in the right WebP or AVIF format), slow hosting that inflates the Time to First Byte, or CSS and JavaScript resources that block rendering.
INP: The Responsiveness That Makes All the Difference
Interaction to Next Paint replaced First Input Delay in March 2024 and is now the main Core Web Vitals optimisation challenge for most sites. This metric measures the time between a user clicking, typing, or touching the screen and the moment the browser displays the visual result of that action.
INP captures every interaction throughout the entire session, not just the first one. If a visitor opens your mobile menu 30 seconds after landing on the page and it takes 500 milliseconds to appear, your INP score suffers. The target: stay under 200 milliseconds for all interactions.
This is a marathon metric, not a sprint. You cannot cheat by optimising only the initial load. Your site needs to remain responsive from the start to the end of the visit, even when heavy scripts are running in the background, even when the user is filtering a product list, even when they are filling out a form.
The main causes of INP failure come from poorly optimised JavaScript: third-party scripts that monopolise the main thread (analytics, chat, marketing pixels), complex animations that force the browser to recalculate the layout, or custom code that executes on every click without being optimised.
CLS: The Visual Stability We Underestimate
Cumulative Layout Shift measures unexpected content movements during loading. You know that frustrating experience: you start reading a paragraph, an ad loads above it and pushes all the text 200 pixels down. Or worse, you click a button that shifts at the last moment and you land on a page you never intended to visit.
Google’s target: a score below 0.1. This score is calculated based on two factors: the impact fraction (the size of the elements affected relative to the visible window) and the distance fraction (the number of pixels of displacement).
CLS is the Core Web Vitals metric with the highest pass rate, because the fixes are relatively straightforward: define explicit dimensions (width and height) for every image, video, iframe, and ad slot. Reserve space for dynamic content. Use font-display swap for web fonts.
A good CLS score may not earn you additional positions, but a poor CLS score will cost you some. And beyond SEO, it is a direct driver of user frustration that impacts your conversion rates.
The 3 Core Web Vitals in 2026
Why Core Web Vitals Impact Your Search Rankings
Google has used Core Web Vitals as a ranking factor since June 2021. But their weight has evolved. With HTTPS security and mobile compatibility now widely adopted as baseline standards, Core Web Vitals optimisation has become the most actionable technical lever Google offers you within the Page Experience signal.
The impact is not absolute, it is contextual. Relevant, well-structured content with average Core Web Vitals will rank better than weak content with perfect scores. Google always prioritises relevance. But at equal content relevance, optimised Core Web Vitals make the difference between the first page and the third.
SEO correlation studies published in 2025 show that INP has become the most discriminating Core Web Vitals signal in competitive markets. Sites that move from “needs improvement” to “good” on INP see measurable visibility gains, particularly on mobile.
The indirect stakes are equally significant. Sites that pass all three Core Web Vitals metrics record 24% fewer bounces and significantly higher conversion rates. Performance is no longer a technical detail, it is a business differentiator. More than 50% of users abandon a page that takes more than 3 seconds to load. Your direct competitor loads in 2 seconds. Guess who gets the customer.
How to Measure Your Core Web Vitals
Google does not measure how fast your page loads. It measures what the user experiences during loading. Does the main content appear quickly? Does the page respond when I click? Do elements move while I am reading? These are indicators centred on real perceived experience, not purely technical measurements like total page weight.
To measure your Core Web Vitals, you need tools that collect two types of data. Field data (or Real User Monitoring) comes from real visitors using your site under real conditions. Lab data comes from controlled tests simulating a standardised device and connection.
Google uses exclusively field data for its ranking algorithm. That is therefore the source you should prioritise for monitoring.
Google Search Console is the primary tool for regular tracking. The “Experience > Core Web Vitals” tab automatically classifies your URLs into three categories: Good, Needs Improvement, and Poor. It shows you how your scores have evolved over the past 90 days, page by page, with a distinction between mobile and desktop. Problematic URLs are segmented by failing metric type (LCP, INP, or CLS) with recommended actions directly in the interface.
PageSpeed Insights combines field data from the Chrome User Experience Report with lab data from Lighthouse. Enter any URL and you get your three Core Web Vitals scores, separated between real data and simulated data. The Opportunities section lists possible improvements with an estimated time saving. The Diagnostics section identifies precise technical causes: images without dimensions, render-blocking scripts, uncompressed resources.
GTmetrix offers a detailed loading visualisation through its waterfall cascade, a chart that shows exactly in what order and how quickly each resource on your page loads. Ideal for understanding where the bottleneck lies.
For high-traffic sites, RUM monitoring solutions such as CoreDash or SpeedCurve allow you to track Core Web Vitals continuously, detect regressions after each deployment, and identify issues by device type, geographic region, or page template.
How to Optimise Each Core Web Vitals Metric
Optimising LCP: The Levers That Work
To get under the 2.5 second LCP threshold, you need to act on several fronts simultaneously. Start with the heaviest element, typically your hero image.
Convert all your images to WebP or AVIF format. These modern formats offer far superior compression to JPEG with no visible quality loss. Size your images to the exact display dimensions, no more. An image of 3,000px displayed at 800px wastes bandwidth.
Use preloading for critical resources. The tag instructs the browser to prioritise downloading your LCP image, main fonts, and critical CSS. Never lazy-load the image that constitutes your LCP, as that would be counterproductive.
Activate a CDN to serve your resources from servers geographically close to your visitors. Optimise your Time to First Byte by enabling server-side caching, using Brotli compression, and choosing a high-performance host.
Eliminate CSS and JavaScript that block rendering. Insert critical CSS directly into the HTML, and defer the loading of the rest using async or defer.
Optimising INP: The Technical Challenge of 2026
INP is the most difficult metric to fix because it touches the very architecture of your JavaScript. You cannot simply compress an image or enable a cache. You need to rethink how your code handles user events.
The browser’s main thread works like a single-window queue. If a massive JavaScript task blocks the queue, no other interaction can be processed. The key principle: break long tasks into smaller ones.
Any task that exceeds 50 milliseconds becomes a “long task” that blocks the main thread. To improve INP, you need to either reduce the duration of these tasks or defer them in time to give priority to user interactions.
Audit all your third-party scripts. List every external script loading on your site: analytics tools, chat widgets, marketing pixels, cookie consent tools. For each one, determine whether it directly contributes to conversion or revenue. Remove or defer everything that is not essential. This audit typically produces the biggest INP gain.
Optimise your animations. Animations that affect layout properties (position, width, height) force the browser to recalculate the layout during interactions. Instead, use CSS transforms (translate, scale, rotate), which are GPU-accelerated and do not block the main thread.
For custom JavaScript, delegate non-critical tasks after user interactions. Use requestIdleCallback to execute code during idle moments in the browser.
Optimising CLS: The Basics to Master
CLS is the easiest metric to fix with simple, direct actions. Every image, video, iframe, and ad slot must have explicit width and height attributes. The browser can then reserve the necessary space before the content downloads.
For web fonts, use font-display swap in your CSS. This property tells the browser to immediately display text using a system font, then switch to your custom font once it has loaded, without any layout shift.
Reserve space for dynamic content. If you are loading customer reviews, recommended products, or banners via JavaScript, define a container with a minimum height to prevent the content below from jumping when the elements appear.
Avoid inserting content above existing content, except in response to a user interaction. Cookie banners, notifications, and ads should appear as overlays or at the bottom of the page, never by shifting the main content.
Real Impact of Core Web Vitals Optimisation
FAQ: Your Questions About Core Web Vitals
What is the difference between the PageSpeed score and Core Web Vitals? The PageSpeed Insights score is a global performance score calculated by Lighthouse, which takes many factors into account. Core Web Vitals are three specific metrics (LCP, INP, CLS) that measure real user experience. Google incorporates Core Web Vitals into its ranking algorithm, not the overall PageSpeed score. You can have a PageSpeed score of 68 with green Core Web Vitals, and conversely a score of 90 with a disastrous CLS. What matters for your rankings is Core Web Vitals, not the synthetic score.
My Core Web Vitals are different between PageSpeed Insights and Search Console. Why? PageSpeed Insights displays two types of data: field data from the Chrome User Experience Report (based on the past 28 days of real visitors) and lab data from Lighthouse (a simulated test at a given moment). Search Console displays only field data over the past 90 days. The differences come from this variation in source and time period. Field data is what counts for your rankings, as it reflects the real experience of your visitors. Lab data is useful for identifying technical issues, but does not represent the diversity of real-world conditions.
Should I optimise Core Web Vitals for mobile or desktop first? Google has used Mobile First indexing since 2019, which means it evaluates and ranks your site primarily based on its mobile version. The majority of your visitors are on mobile, and it is the mobile version that carries the most weight in your rankings. Prioritise optimising mobile Core Web Vitals first. In Search Console, focus first on URLs flagged in the “Mobile” tab, then move to desktop once your mobile scores are in the green.
How long does it take to see the impact of a Core Web Vitals optimisation? The Chrome User Experience Report data updates daily, but Google uses a rolling 28-day window to calculate your scores. This means that after deploying an optimisation, you need to wait around 28 days for the improvement to be fully reflected in your field data. In Search Console, expect between 2 and 4 weeks to see the effect of a fix. To track your progress more quickly, use PageSpeed Insights in lab mode or a RUM tool that measures your visitors in real time.
Can a WordPress site have good Core Web Vitals? Yes, absolutely. WordPress itself is not the problem. What degrades Core Web Vitals on WordPress is the accumulation of poorly optimised plugins, bloated themes, and low-end hosting. A well-configured WordPress site with a lightweight theme (such as GeneratePress or Astra), a high-performance caching plugin (WP Rocket or LiteSpeed Cache), an active CDN, and optimised images can achieve excellent scores. The key is to be selective about the plugins you install and to choose hosting suited to your traffic levels.