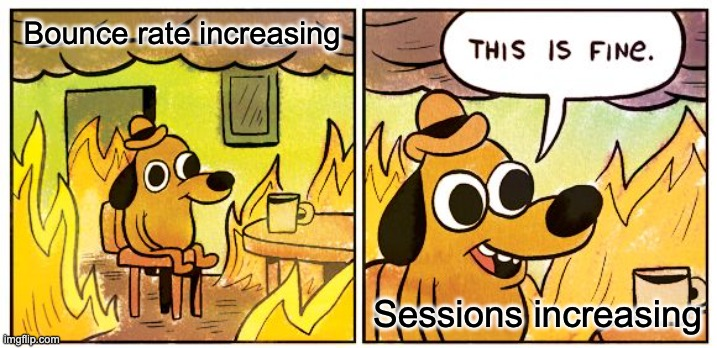
The bounce rate gets a bad rap. It sits at the top of your reports, displays numbers that don’t help your stress levels, and sometimes seems to tell a story that isn’t yours. Yet, when properly interpreted and managed, it becomes one of the most useful indicators for understanding the connection, or lack thereof, between your visitors and your promise.
In Google Analytics GA4, this percentage is no longer just “one page and then they leave”: it is the inverse reflection of engagement. In other words, every time the user doesn’t truly engage with your content, the counter goes up. Our goal here is simple: to bring clarity to the definitions, explain how to read and use the data, then outline a concrete method to lower this bounce rate without compromising the user experience or search intent.
The Bounce Rate: a Measure of Fit
Let’s forget the spreadsheets for a second. Imagine a physical store: someone walks in, takes a look, and leaves. Is that a failure? It depends on the intent. If they were looking for very specific information, received immediately, their “visit” fulfilled its purpose, even if it was brief. This is exactly the ambiguity of the bounce rate: it’s a thermometer that measures the gap between what the user expects and what your page offers in the first few seconds.
In GA4, the metric is no longer calculated as before. We now talk about engaged sessions (minimum duration, conversion, or at least two screen/page views). The bounce rate is then, simply put, 100% minus the engagement rate. This avoids classifying useful but silent visits as “bounces”: the user reads a very comprehensive guide, spends time, and finally clicks on a phone number… If they crossed the engagement threshold, it’s no longer a bounce. This is a crucial nuance for marketing and product teams who work on the quality of the interaction, not just the quantity of page views.
Why this Percentage Deserves your Attention
One could ignore it in favor of final conversion. Bad idea. The bounce rate tells the story of the top of the funnel: a page’s ability to welcome, reassure, and guide. When it inflates, it often means that money invested in acquisition is diluted: paid ads that promise A but landing pages that deliver B, poorly targeted SEO queries, overly vague titles, loading times that stretch patience. Conversely, the day you realign promise and content, when your page becomes clear, fast, and useful, you almost always see the same chain of effects: a decrease in bounce rate, an increase in deep clicks, progression of micro-conversions, and logically better business results. For your board, it’s an indicator of business consistency as much as web performance.
How Google Analytics Measures It
Practically speaking, the data lives in the Engagement and Acquisition reports in GA4. It makes full sense when cross-referenced by traffic source, page type, and device. An SEO visitor landing on a “how-to” article doesn’t have the same expectations as a SEA prospect clicking on “Free Quote”.
By configuring your events (CTA clicks, scroll depth, video viewing) and your conversions (appointment booking, demo request, add to cart), you transform a percentage into an actionable KPI.
This is also where Google Tag Manager comes in: proper configuration prevents you from confusing silence with disinterest. If you want a reminder of the official definitions, the GA4 documentation remains the reference, but the real action happens with your event model and your naming conventions.
The Invisible Causes of a Rising Bounce Rate
In most of the audits we conduct, the bounce rate is not explained by a single technical reason but by a cluster of micro-frictions. First, search intent: the user has a specific question, and your first lines don’t answer it. You talk about yourself when they want to talk about themselves.
Next, speed: two seconds of 4G latency are enough to break momentum.
Then comes usability: a generic H1, an overly compact paragraph, a button too low, a menu that hesitates between saying everything and saying nothing. Add a poorly considered mobile experience, clickable areas that are too small, pop-ups that jump onto the screen, and you get a perfect cocktail for the user to slide back.
Finally, there’s acquisition-content alignment: if your SEA ads promise “immediate rates and deadlines,” but the page offers a corporate brochure and an eleven-field form, the bounce rate does its job: it reminds you that the promise isn’t kept.

Speed, or the Art of not Making People Wait
To talk about bounce rate without addressing performance would be to ignore gravity. The Core Web Vitals (LCP, INP, CLS) are not just engineering jargon: they describe the feeling of speed and stability. A page that loads quickly, responds to gestures, and doesn’t jump when clicked, retains users better.
Tools like PageSpeed Insights are useful for objectifying the discussion and prioritizing tasks: image compression, lazy-loading, minification, caching, CDN, and often a simple cleanup of marketing scripts. It’s rarely discussed, but an overly heavy theme or a page builder that multiplies dependencies can add half a second to each view.
On a monthly scale, that translates into hundreds of lost visits and a bounce rate that refuses to drop. Discover how to improve your website’s speed.
The First Impression: Clear Promise, Quick Proof, Open Path
When someone opens your page, what do they understand in three seconds? Ideally, who you are, who you work for, what one gains here, and how to proceed. An H1 that speaks to benefits rather than slogans, a subtitle that clarifies, a micro-paragraph that sets the context, a visible CTA that suggests the logical next step (try, compare, request a quote, download).
Nearby, social proof: client logos, reviews, real mini-case studies. It’s not ornamentation; it’s a contract with the reader. And this contract has a direct effect on your bounce rate: the faster the page meets expectations, the longer the visit continues. The rest of the page can then guide: short sections, explicit subheadings, well-placed internal links to complementary content (a case study, a service page, a detailed guide).
The numbers haven’t lied for a long time: the majority of first impressions occur on mobile. A mobile-first designed page mechanically reduces the temptation to go back. We emphasize the fundamentals: readable font, generous line spacing, comfortable buttons, short forms. And most importantly, a first screen that doesn’t hide the essentials. Many bounce rates are explained by this detail: a CTA pushed below the fold by a banner or visual, however pretty it may be.
From Diagnosis to Action
Progress begins with measurement: identify high-traffic pages whose bounce rate exceeds the average, segment by source and device, observe actual loading speeds. Then, formulate concrete hypotheses: “the title doesn’t match the intent,” “the CTA is not visible on mobile,” “time to first render exceeds three seconds.”
Next comes prioritization: we first tackle high-impact, low-effort levers. When a strategic service page takes four seconds to stabilize, you don’t start by redesigning the graphic charter.
Finally, we experiment: A/B testing on the title, moving a CTA to the top, cleaning up scripts, rewriting an intro paragraph. Two to three cycles are often enough to see the bounce rate decrease and deep clicks increase. The key is to document your tests: what works on a paid landing page doesn’t necessarily apply to a blog post.
Reading Bounce Rate and other KPIs
A bounce rate never lives alone. It is read in conjunction with the engagement rate, pages per session, average duration, and, of course, conversion. On a blog, a higher bounce rate is not a disaster if time spent increases and the content leads to the newsletter or a premium resource.
On a product page, however, the expectation is higher: clicks towards adding to cart or configuration are expected. It’s also important to distinguish between exit and bounce: not all exits are failures. Sometimes, the last page perfectly fulfilled its mission (finding a contact, downloading a PDF, checking a price). This nuanced perspective avoids hasty decisions, such as “let’s multiply pop-ups,” a remedy worse than the disease.
What Now?
If you had to choose a first step, it would be this one: take your most strategic page, open it on a phone, look at it as if you’ve never heard of your brand, and ask yourself: “What am I being promised? What do I gain here? What’s the next step?”.
Then open Google Analytics, check the events that matter, and measure the effect of small improvements. Optimization is not a one-time sprint; it’s a routine. But it’s a profitable routine.
To go further, our teams at Donutz can audit your GA4 configuration, streamline your tracking, establish clear prioritization, and execute optimizations that will lower that bounce rate without sacrificing your identity. And yes, we keep the humor, but most importantly, we keep the results.
You can explore our Google Analytics & Tracking Agency (GTM/Server-Side), SEO Agency, and Google Ads Agency offers. For the performance aspect, a detour through PageSpeed Insights and the official documentation on Web Vitals never hurts.
FAQ
What is a “Good” Bounce Rate?
There is no universal number. On an offer or landing page, staying below 50% is often a good sign; on an informational article, more can be accepted if the time spent is solid and the page leads to a logical next step (newsletter, resource, contact). What’s important is the trend and consistency with the page’s objective.
Where to Find the Metric in GA4 and how to Usefully Activate it?
In the Engagement and Acquisition reports, add the bounce rate column and cross-reference it by source, page, and device. Supplement with well-defined events (deep scroll, CTA click, download) to avoid classifying as bounces visits that have, in reality, interacted. This granularity transforms a percentage into an action plan.
Does Bounce Rate Influence My SEO?
Indirectly. Google doesn’t “read” the raw metric; however, it values fast, stable, and useful sites. Everything that lowers your bounce rate: better content-intent alignment, better performance, better clarity, tends to improve your quality signals, and thus your visibility.
How to Quickly Reduce Mobile Bounce Rate without Redoing the Site?
Start with hierarchy: clear promise and visible CTAs right from the home screen. Ensure readability (contrast, font size, spacing), prune superfluous scripts, and ensure navigation remains smooth with a thumb. A few well-targeted adjustments often yield spectacular gains.


